Getting started with Scrutinizer Code Intelligence
1. Setting Up Your Project on Scrutinizer
First, set-up your project on Scrutinizer. This will generate a default configuration, and set-up hooks so that new inspections are automatically triggered when a pull-request is made or when you push changes.
If you have added your project some time ago, make sure that you have the respective analysis tool added to your configuration:
- For PHP: PHP Scrutinizer
- For Python: Python Scrutinizer
2. Installing the Browser Extension
The Browser extension automatically retrieves intelligence data and adds it to the code as you browse GitHub or Bitbucket.
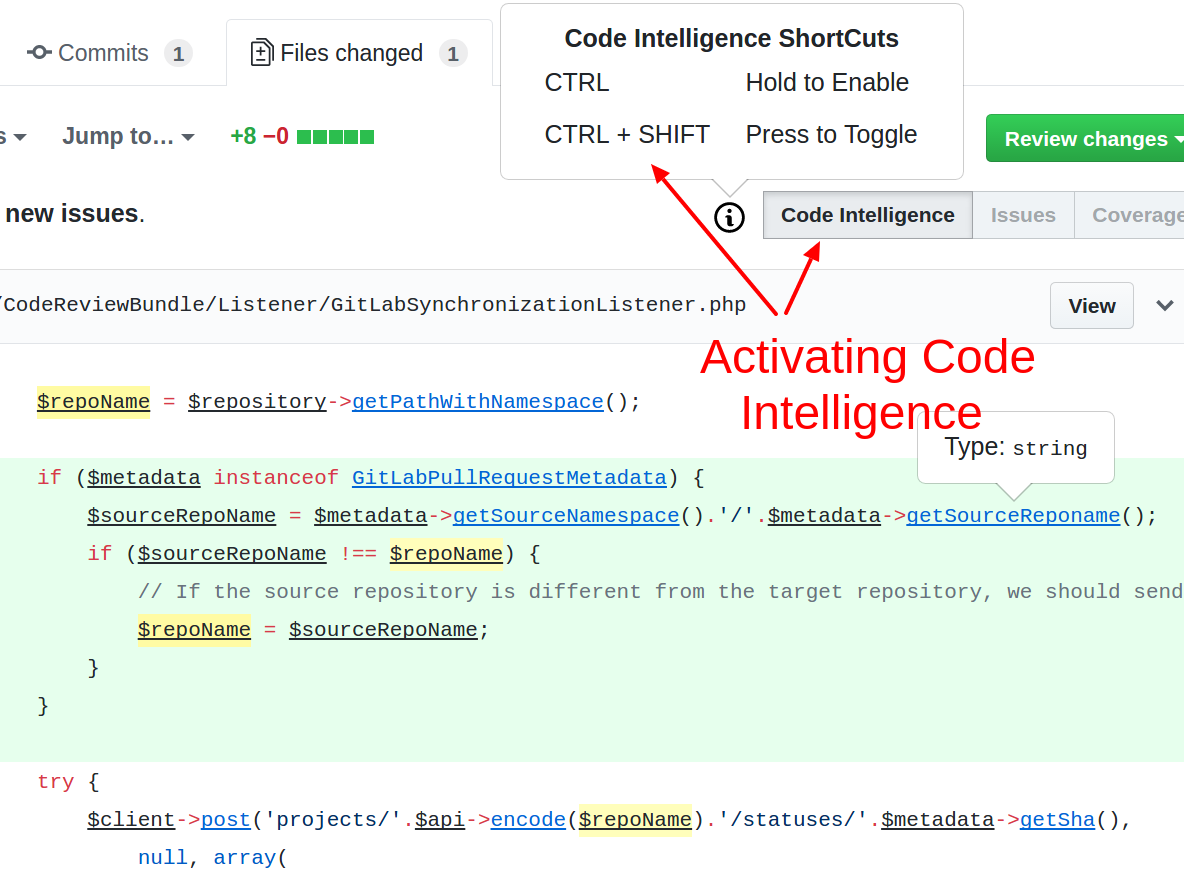
3. Accessing Code Intelligence Data
Browse to one of your files on GitHub/Bitbucket or view a pull-request. You should now see a Code Intelligence button at
the top right. You can click that or use one of the keyboard shortcuts (CMD/CTRL or CMD/CTRL + SHIFT).
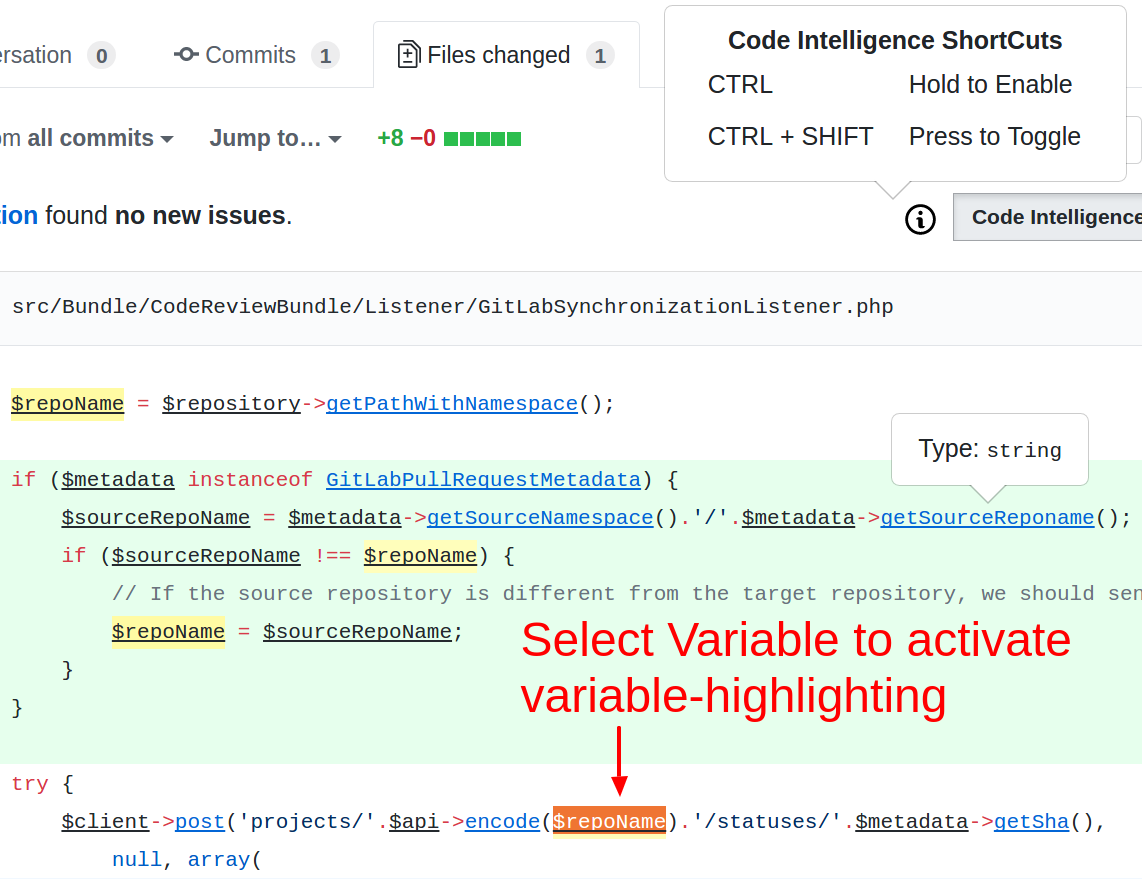
Variable Highlighting
To see where a variable is used, simply click on the variable or select part (or all) of the variable name. The variable itself should now become highlighted. Where a variable is defined, the color will be a bit darker than in other locations where it is just read.
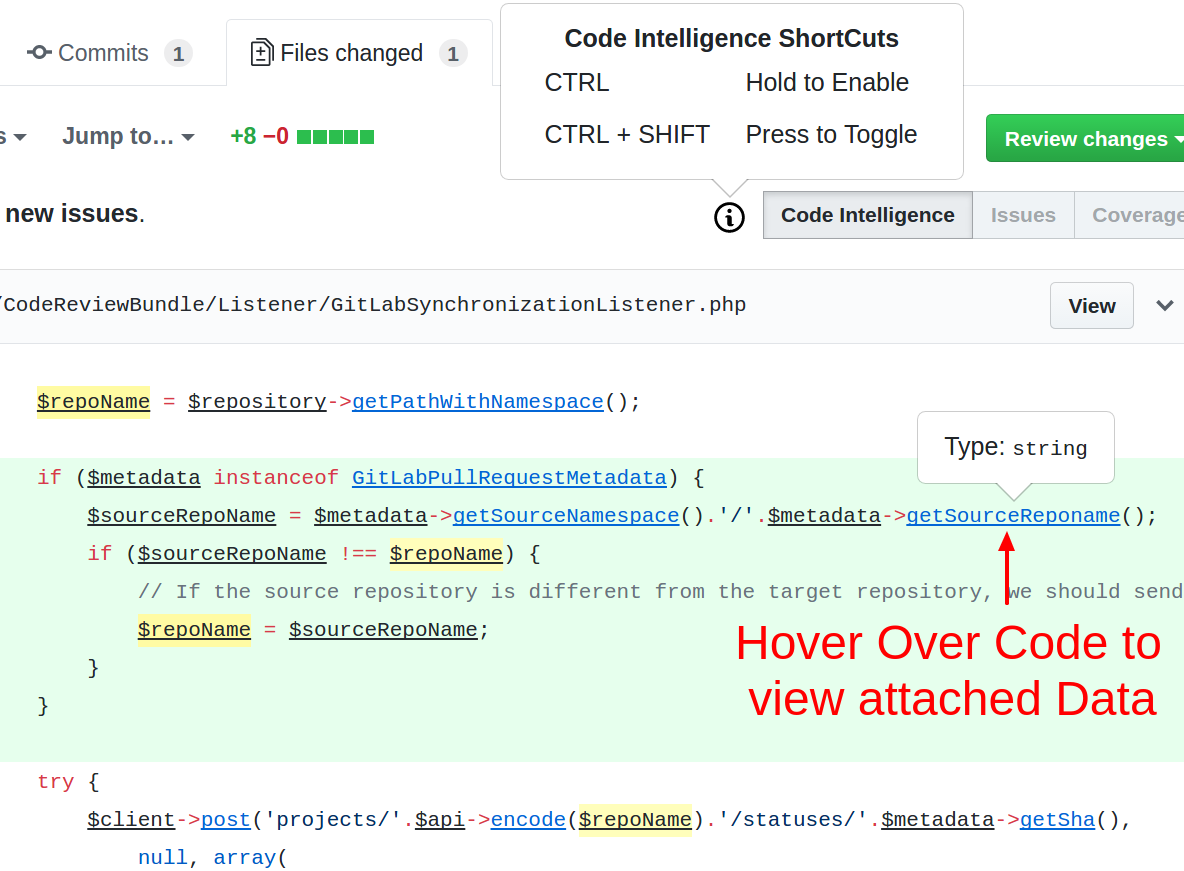
Viewing Attached Data
Many code fragments have data like type information attached. To view this data, toggle code intelligence either via the button at the top or via one of the keyboard shortcuts. Code fragments with data are now marked with an underscore. Now simply hover the fragments you are interested in.
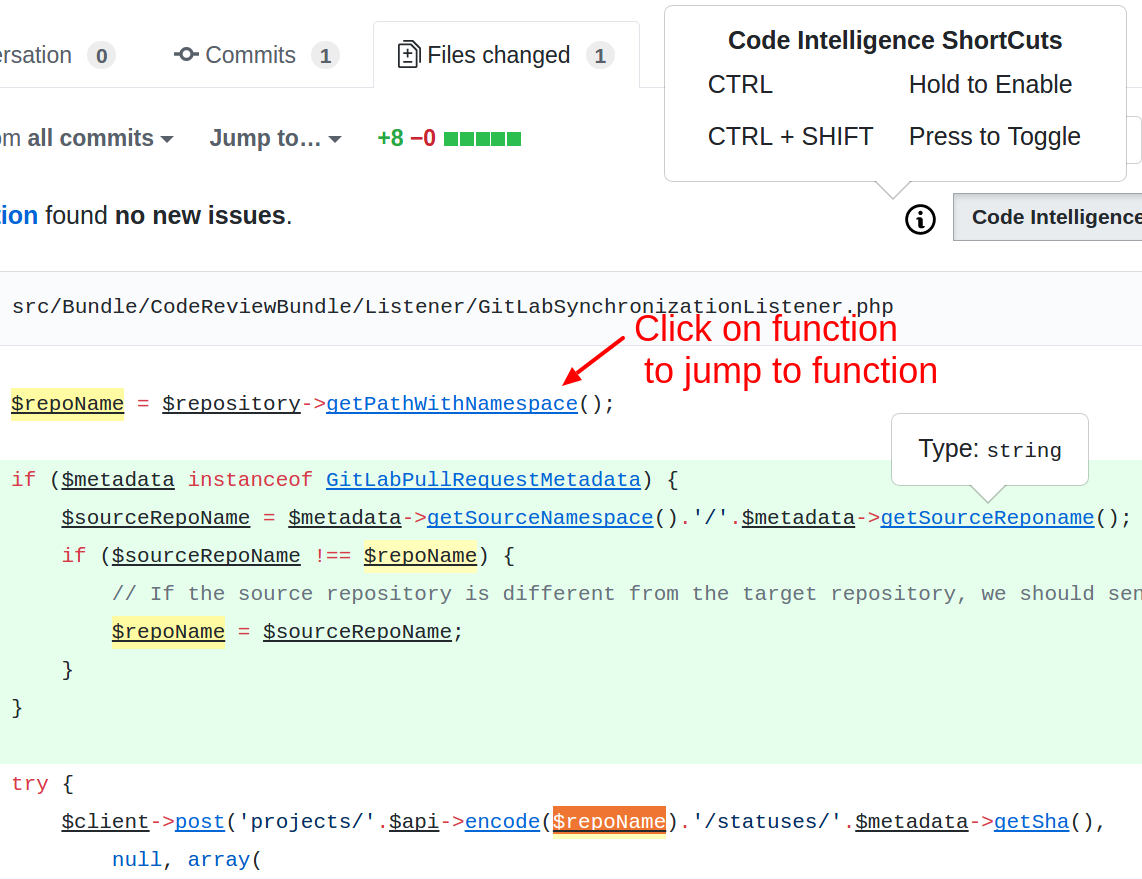
Jumping into Functions/Methods
Some code fragments like function calls point to other areas of your project, or even another project. Scrutinizer turns those fragments into regular links you can open and directly jump into the function.