 jzagalo
Support of our Chrome Extension has been extended to now also include the Bitbucket platform. In addition, we now provide a new Firefox extension also with support for GitHub and Bitbucket.
| GitHub | Bitbucket | |
|---|---|---|
| Chrome | new | |
| Firefox | new | new |
The increased platform and browser support will greatly help users to review their code directly on their favorite platform. The new release also comes with major architectural improvements and some newly added features. Changes have been made to the UI and the general user experience has been improved.
Code Intelligence and Code Coverage are now available for all pages that show source code on both GitHub and Bitbucket. This was only available for diffs initially.

The extension will now remember the toggling state of issues, code coverage and code intelligence. This significantly improves the user experience as you navigate through files within a project or between projects.
The browser extension is now more robust, with faster loading time delivering a better user experience to our users. In particular, we improved handling of asynchronously loaded pages.
You can read more in the extension documentation and as always happy scrutinizing!
 linglongscru
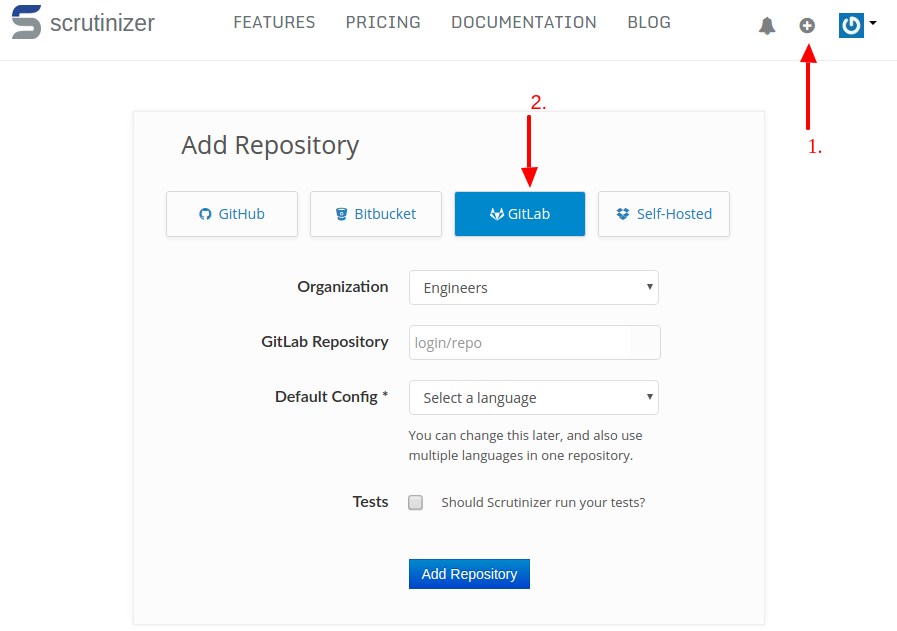
Good news for GitLab users! We are happy to announce that now Scrutinizer also supports GitLab repositories - be that self-hosted on your own instance or on gitlab.com.
Like for GitHub and Bitbucket, each time you push a commit or create a merge request, an inspection will automatically be triggered and the status communicated back to GitLab.
To add a GitLab repository, simply select GitLab on the repository add page:
In our documentation, we have some more details about how to set-up your GitLab instance.
And as always - happy scrutinizing :)
 h2p3m
h2p3m
Selenium is a great tool for running UI based tests. You can get automated browser tests up and running in a matter of hours. However, as easy as Selenium is to set up. Selenium tests can be unstable, sometimes they work and now and then they fail.
Understanding why a Selenium test failed can often be a painful and time-consuming process. We have created this feature to take the pain out, and drastically reduce the time you spend to figure the causes out.
For all of your test commands in the tests section of your .scrutinizer.yml,
we record any activity that occurs on the build machine’s display. If your test
fails, the recording is stored and you can use it for quickly debugging the
failure. Let’s take a look:

The display recording and the console output of the running task are displayed in sync. As the video is played, we re-play the output as it happened when your tests were running. So when you see an error on the display, you can see which step was executing on the command line and vice-versa.
Recordings are automatically enabled for all repositories, and even if you heavily use the UI, they cause virtually no overhead. We observed a maximum of 3% added CPU usage. If your task succeeds, the recording will be discarded. If it fails, we encode it at the end of your run so that you can view it in your browser.
While an inspection is running in SSH debug mode, you can now also view a live stream of the display without having to go through any complicated set-up directly in the browser. Checkout the new “Display” tab:

We think this will make Selenium tests a lot more enjoyable.
Let us know what you think! :)
 schmittjoh
We are happy to announce the availability of our new Chrome extension. It boosts productivity by allowing you to now view analysis result directly inside GitHub. You do not need to leave the page, but you can go through the issues just when you manually review the code:

The extension is still in beta as we add some more features. You can check out our documentation for the features that are already available.
Happy & productive scrutinizing!
schmittjoh
Just a bit over a week ago, we released our new PHP security analysis; it checks your PHP projects for over 500 security vulnerabilities from categories such as XSS, different injection vulnerabilities, file inclusion, code execution and a lot more.

Yesterday, YOAST - a developer of several popular Wordpress plugins -, and others released several security updates that fix XSS vulnerabilities found by Scrutinizer. Since some of the potential attack vectors were found in several WordPress plugins, WordPress’s developer documentation was updated as part of the coordinate response, too. If you are using WordPress, make sure to upgrade your plugins to the latest versions.
XSS, short for cross-site scripting, allows an attacker to inject code into an HTML response, typically Javascript, that is then executed by your browser. It can be used to perform actions with your privileges, or obtain your data, and passwords. How seriously you are affected by this depends on several factors such as the browser you are using, and certain headers that sites sent for example.
Scrutinizer also found other vulnerabilities that are still being fixed at the moment. We will share more once the security releases have been made, and users have had a chance to upgrade.
Happy & Secure Coding! :)